
A chart is available that provides a breakdown of the non-billable time that has been recorded in timesheets by time activity. This provides the firm with an understanding of how non-billable time is being spent.
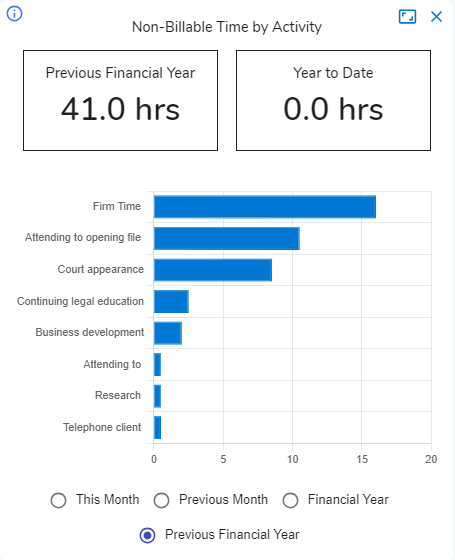
The chart only shows non-billable hours for the date range selected. The available date range selections are:
This Month
Previous Month
Financial Year
Previous Financial Year.
When used on the Firm Dashboard the chart shows the non-billable hours for all staff for the firm, office, department or team, depending upon the scope selected.
When used on the Fee Earner Dashboard the chart provides a handy overview of the users personal non-billable time.
The expand button in the top right of the chart is available to show greater than 10 non-billable activities.
A drilldown is available from the total or from each individual bar on the chart. The drilldown shows a list of the time sheet lines associated with the specific area of the chart selected.

The RedView Team